The Black Screen Wasn't CSS: How Open Nua Stopped a Snapshot Storm in the Conversation Detail View
Open Nua Engineering
The performance problem in Open Nua's conversation detail view did not first appear as a clean flame graph.
It appeared as a black screen.
During repeated development runs of a Vibe Trading research workflow, the Desktop window would become an unresponsive black surface. Electron Main, GPU, utility processes, and the Python bridge were still alive. The Agent run could remain busy, but the user could no longer see progress, cancel the task, or recover the conversation.
It was also intermittent. One attempt to reproduce the same 2513.HK workflow did not fail. At that point, render-process-gone, exit code 5, and a stressful long conversation were not enough evidence to label the cause OOM.
This is not a story about adding virtualization to a React list. It is about turning an intermittent black screen into a machine-detectable Renderer crash, tracing how a 2.2 MiB conversation snapshot created several GiB of allocation pressure, and learning why an initial backpressure fix correctly bounded in-flight bytes yet did not prevent the black screen from returning.
The first optimization already existed—so why did the screen still go black?
Open Nua had already optimized token-level streaming. Canonical history changed only when message identity, order, tool structure, or run completion changed. Pure content deltas stayed in a per-thread live overlay instead of reordering all history or notifying every ThreadContext consumer for each token.
That fixed one form of amplification, but long Agent tasks produce another kind of traffic: full state snapshots.
A real execution crosses the Python Agent Bridge, Electron Main, IPC, Renderer transport, the LangGraph SDK external store, ThreadContext, and the Chat view. Text deltas are incremental. A values event may carry the entire current messages state. As a complex graph moves rapidly between nodes and middleware branches, it can emit several full snapshots even when messages did not change.
The first stability fix added a per-run credit relay in Electron Main. It counted UTF-8 bytes sent but not yet acknowledged as consumed by the Renderer. Its high watermark was 1 MiB and its low watermark 512 KiB. At the high watermark, Main stopped pulling the Python async iterator, propagating transport backpressure through the stdout reader toward the producer.
That design fixed a real unbounded queue. It also removed an incorrect Renderer overflow path that cancelled the run, cleared queued protocol events, and silently discarded execution facts. Tool lifecycle, HITL, errors, cancellation, and terminal events could no longer disappear in the name of protecting the UI.
Then, after the 0.8 work was complete, another Vibe Trading conversation went black.
That recurrence revealed the distinction that shaped the rest of the investigation:
Bounding how much data is in flight does not bound how much work each admitted event creates after arrival.
Turn “black screen” into a machine fact
We did not begin by changing code. We first built a temporary CDP harness that connected to the Desktop Renderer target, evaluated a minimal DOM expression, and produced a stable result within three seconds:
BLACK_SCREEN_REPRO: RED {"ok":false,"reason":"renderer CDP unresponsive"}
This was more useful than another screenshot. It showed that a dark overlay was not merely covering the page and CSS had not painted the content black. Process inspection also showed that Electron Helper --type=renderer was gone while Main, GPU, utility processes, and the Python bridge remained.
The diagnosis moved from “the page looks black” to “the Renderer exited or cannot execute.” We could now falsify explicit hypotheses:
- A JavaScript busy loop predicts a live Renderer process with high CPU.
- A GPU black frame predicts a responsive DOM and CDP session.
- A Vibe Trading runtime or API failure predicts a controlled service error, not a vanished Renderer.
- A native Renderer fatal crash or memory pressure predicts a crash journal, minidump, and abnormal memory timeline.
Process state and CDP quickly eliminated the first three explanations.
The Renderer crashed, but the native cause remained bounded by evidence
Crashpad left a pending minidump of roughly 922 KiB. The local crash journal recorded crashed, exit code 5, and 60 safe Renderer memory samples collected every two seconds.
Across the two-minute window, Renderer working set rose from roughly 5.75 GiB to a peak of 8.64 GiB; the last sample was still about 7.63 GiB. A similar black screen the previous day also ended with exit code 5 and had exceeded 11 GiB. The incident was now a reproducible Renderer memory-loss-of-control pattern, not a one-off visual glitch.
LLDB opened the minidump read-only and found an EXC_BREAKPOINT in the stripped Electron Framework. That proved a native fatal trap or CHECK in the Renderer rather than an ordinary JavaScript exception missed by a React error boundary. Without matching Electron/Chromium symbols, however, it did not justify inventing a more precise V8, Mojo, or Chromium function name.
We confirmed the crash and preserved what remained unknown.
The business result was only a few MiB—where did the GiB come from?
The next step aligned the memory timeline with the actual execution. Environment ownership mattered: local development Desktop used PostgreSQL, so reading the prod-sim SQLite path would have produced a false absence of data.
After correlating the active thread, interaction, and execution journal, the stored data was modest:
| Object | Size or count |
|---|---|
Persisted thread_values | about 114 KiB |
| Content across 133 unique messages | about 1.67 MiB |
| One fully serialized message snapshot | about 2.2 MiB |
| New content in the active turn | under 100 KiB |
The research result itself was not several GiB. Cumulative database checkpoint and message writes were only tens of MiB.
The timing was more revealing. Graph steps 25–32 completed in roughly 0.19 seconds. Most middleware branch checkpoints did not write a new message, yet the Renderer added about 500 MiB in the adjacent four seconds. Growth correlated with checkpoint count, not new content bytes.
We then replayed 34 snapshots of roughly 2.2 MiB offline to challenge the hypothesis that the normalizer permanently retained every array. After forced GC, heap grew by only about 2.28 MiB and RSS by about 18.8 MiB. The existing 50,000-content-delta pressure test also continued to pass.
This was not a simple retained-array leak, and it was not the token-delta path already optimized. The failure required the real Electron pipeline.
The root cause was repeated cross-layer amplification
The final chain was:
- LangGraph v3 emitted
valuesevents at graph and middleware checkpoints. A branch-only change could still carry the completemessagesstate. - The Python bridge forwarded every
values.messages, sending the same roughly 2.2 MiB history repeatedly through Python, Main, and Electron structured clone. - The Renderer normalizer rescanned, transformed, and byte-bounded each new object. Its content was identical, but structured clone had changed object identity.
- LangGraph SDK
useStreamhad no throttle, so everyvaluesevent synchronously notified React subscribers. ThreadContextreconciled the full array again. New deserialized objects forcedLiveStreamMessageReconcilerto repeat stable serialization and structural/value signatures.- The detail view displayed only the latest 50 messages by default, but a new array still rebuilt message groups, tool-result indexes, and the component tree.
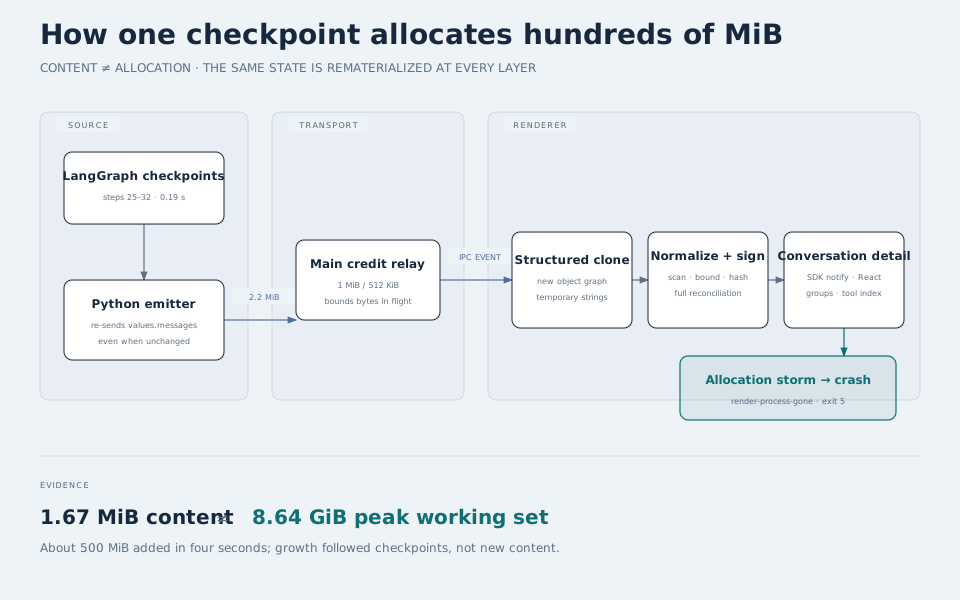
No individual layer easily explains 8 GiB. Structured clone, temporary strings, full scans, signatures, external-store notifications, and React renders stacked during a checkpoint burst, allocating faster than GC could recover.
The credit relay had not failed. It bounded unacknowledged bytes in flight. The incident was dominated by processing amplification inside the Renderer for each admitted full event.
Deduplicate at both source and sink
Memoization at the React edge was insufficient. By then the 2.2 MiB snapshot had already been serialized in Python, transferred over IPC, structured-cloned, and normalized.
The final fix added two defenses.
At the Python source, _ProtocolEventEmitter computes a SHA-256 revision over the controlled JSON representation of values.messages after turn metadata stamping:
- When the revision changes, the wire payload includes full
messagesandopen_neo_messages_revision. - When it is unchanged, only
messagesis removed from the wire payload; branch, todo, and other state fields still travel. - Python retains the complete original state internally, so token usage, checkpoint buffers, and accounting semantics do not change.
At the Renderer sink, the normalizer prefers the source revision and short-circuits repeated snapshots before message transformation, subagent scanning, and snapshot bounding. Old bridges, journal replay, and revision-less events receive a fallback signature composed from message count, serialized character count, and two rolling hashes.
Finally, useStream gained a 16 ms throttle to coalesce subscriber notifications to a frame. The stream manager still consumes events in order, and Renderer acknowledgements and terminal semantics remain unchanged. React simply stops observing every intermediate snapshot in the same frame.
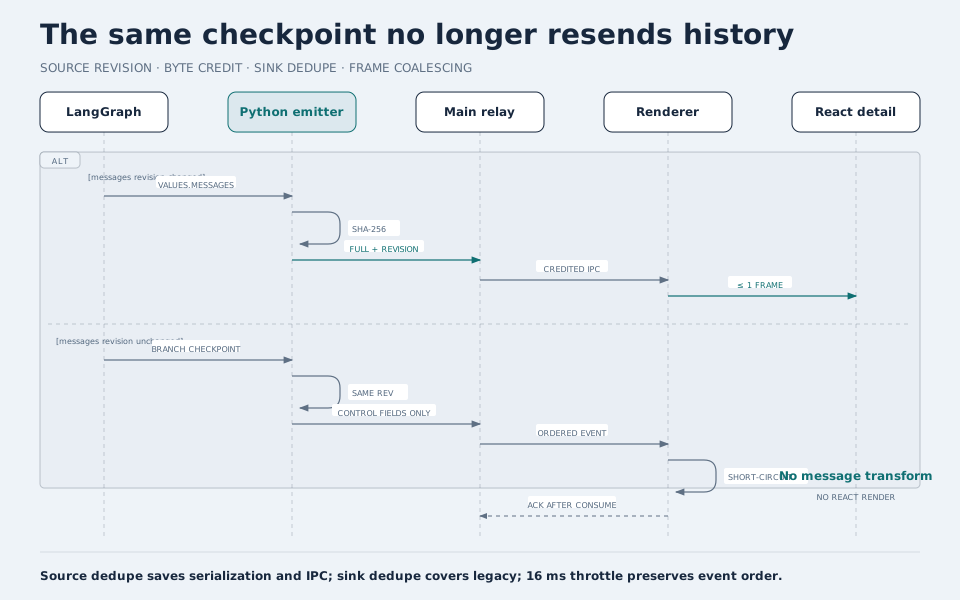
The new path is: the first or genuinely changed full snapshot calibrates message state; later checkpoints with unchanged messages carry only control fields; text and tool content continue through incremental message events.
Reloading the window is not crash recovery
The incident had a second user-visible symptom: after the Renderer exited, the original conversation remained permanently busy.
A crashed WebContents does not necessarily report isDestroyed() immediately. The relay therefore retained unacknowledged credit, the Renderer could never ack it, and both the Main invocation loop and Python producer waited forever.
The new recovery coordinator follows a fixed order:
- Select only active runs bound to the crashed
WebContents.id. - Detach the relay, release waiters, and remove the crashed target window.
- Mark the Main-owned lifecycle
system-interrupted, then abort the Python execution. - Persist the thread as
interruptedwithis_running=false. - Preserve the
renderer-crashmeaning instead of rewriting it as user cancellation or HITL waiting. - Automatically reload only for
crashedandoom, avoiding reload loops for clean exit or integrity failure.
This path does not pretend that the task succeeded or blindly replay execution with potentially completed side effects. It preserves checkpoints and history while recording a recoverable system interruption.
Write the red tests, then return to the black screen
Before the implementation changed, three tests failed by design: the Python emitter resent identical values.messages; the Renderer regenerated full values for reference-distinct but content-identical legacy snapshots; and Main lacked the required “detach → system-interrupted → abort → persist” crash recovery sequence.
After those tests turned green, validation returned to real Electron. The final pressure run injected 100 full tool-history snapshots of about 1.9 MiB each into the Renderer—a total input of roughly 187.5 MiB.
The Renderer delivered only the first values and terminal done, retained about 1.24 MiB of visible data, and grew heap by about 10.09 MiB after forced GC. The CDP DOM expression remained immediately responsive. After restarting the affected Desktop, Renderer readyState was complete, and the original Vibe Trading thread changed from permanently busy to interrupted, is_running=false.
The delivery baseline finished with Python 971 passed, 3 skipped, Node 413 passed, and Renderer/Web 543 passed, along with typecheck, Ruff, and the existing stream-memory pressure suite.
These numbers do not claim that every possible Renderer crash has been eliminated. They show that the observed amplification path is now a regression constraint and that both original symptoms—the black screen and the stuck run—returned to machine-verifiable green states.
Six lessons from all those black screens
1. Convert the user symptom into a machine test first. “Black screen” must become CDP, process, and crash-artifact evidence before choosing among CSS, GPU, runtime, or memory explanations.
2. Backpressure and amplification are different problems. Credit windows bound in-flight data; revision deduplication bounds repeated work. Either layer can fail independently.
3. Equal content does not imply equal objects. Structured clone destroys reference equality. Cross-process streams need a source revision and a compatibility fallback.
4. Deduplicate as close to the source as possible. React memoization can save rendering, but not serialization, IPC, cloning, or earlier scans.
5. Crash recovery belongs in a performance fix. If a dead Renderer leaves a run permanently busy, a performance failure has become a consistency failure.
6. A minidump without symbols does not license an over-precise story. We could prove a fatal trap, runaway memory, and processing amplification. The unsupported native function name remained unknown.
The final fix was not for a black-colored page. It corrected a false assumption in a cross-process state pipeline: that a bounded queue makes the Renderer safe.
A dependable conversation detail view must limit not only how much data is arriving, but also recognize when that data is the same state it just processed.